¶ Version Details
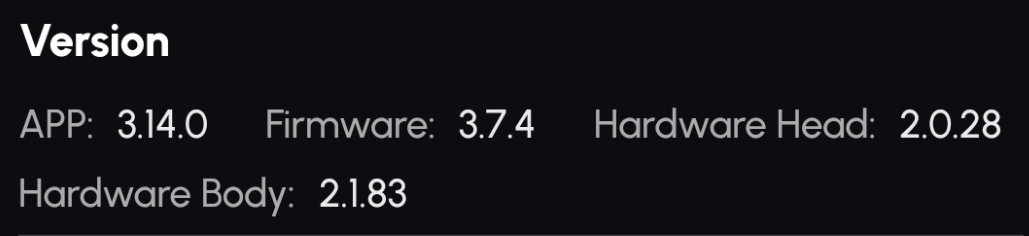
¶ App
Description: Displays the current app version for troubleshooting.
Notes: Shows the version number in numeric format.
¶ Firmware
Description: Displays the firmware version of the device.
Notes:
- Shows the version when connected.
- Displays empty if not connected.
¶ Hardware Head
Description: Displays the hardware version of the device’s head component.
Notes:
- Shows the version when connected.
- Displays empty if not connected.
¶ Hardware Body
Description: Displays the hardware version of the device’s body component.
Notes:
- Shows the version when connected.
- Displays empty if not connected.
¶ Network Information
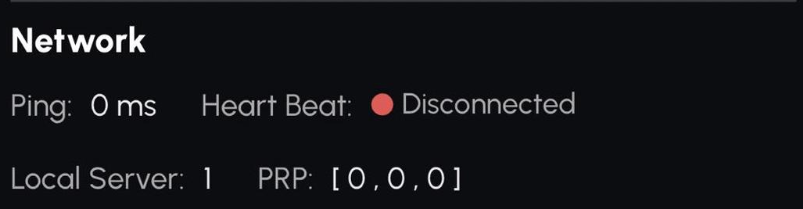
The Network module provides details about the network connection status, helping to evaluate connectivity and diagnose issues.
¶ Ping
Used to test the network connection's availability and response time. It also helps evaluate network latency. The response time is displayed in milliseconds (e.g., 200ms).
¶ Heart Beat
Checks the connection status between two devices or servers. Disconnected indicates the connection is not active, while Connected means the connection is normal.
¶ Local Server
Indicates whether the app's local server is connected. A value of 0 means disconnected, and 1 means connected.
¶ PRP (Plan, Recharge, Pause)
Displays the automatic scheduling status to improve efficiency. The status is represented as a numerical array in the format [0,0,0], where the values correspond to plan, recharge, and pause respectively.
¶ Cellular Information
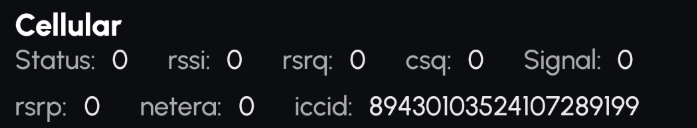
The Cellular module provides information about cellular connectivity, signal strength, and SIM card details to help monitor and diagnose network performance.
¶ Status
Displays the current 4G network status.
- 0: Not connected.
- 1: Connected
¶ RSSI (Received Signal Strength Indicator)
Indicates the received signal strength, commonly used to evaluate cellular signal quality.
- Range: -120 dBm (very weak) to 0 dBm (very strong).
- -1: No data displayed if the device is disconnected.
¶ RSRQ (Reference Signal Received Quality)
Measures signal quality in LTE networks.
- Range: -20 dB (poor) to -3 dB (good).
- -1: No data displayed if the device is disconnected.
¶ CSQ (Signal Quality)
Indicates signal quality in GSM networks.
- Range: 0 to 31 (higher is better).
- 0: No signal or large error.
- -1: No data displayed if the device is disconnected.
¶ Signal
Displays the overall signal strength, including RSSI and other metrics.
- Range: -120 dBm (very weak) to 0 dBm (very strong).
- -1: No data displayed if the device is disconnected.
¶ RSRP (Reference Signal Received Power)
Measures LTE signal power.
- Range: -120 dBm (very weak) to 0 dBm (very strong).
- -1: No data displayed if the device is disconnected.
¶ NetEra
Shows the current network technology code used by the device.
- Values: 2G, 3G, 4G, 5G.
- -1: No data displayed if the device is disconnected.
¶ ICCID (Integrated Circuit Card Identifier)
Displays the unique SIM card identifier for the device.
- Typically 19–20 digits.
- If disconnected, no data is displayed.
¶ ICCID Description
Indicates if the current SIM card is an internal card.
- Displays "CN" for internal cards.
- Displays the ICCID directly for external cards.
¶ RTK Information
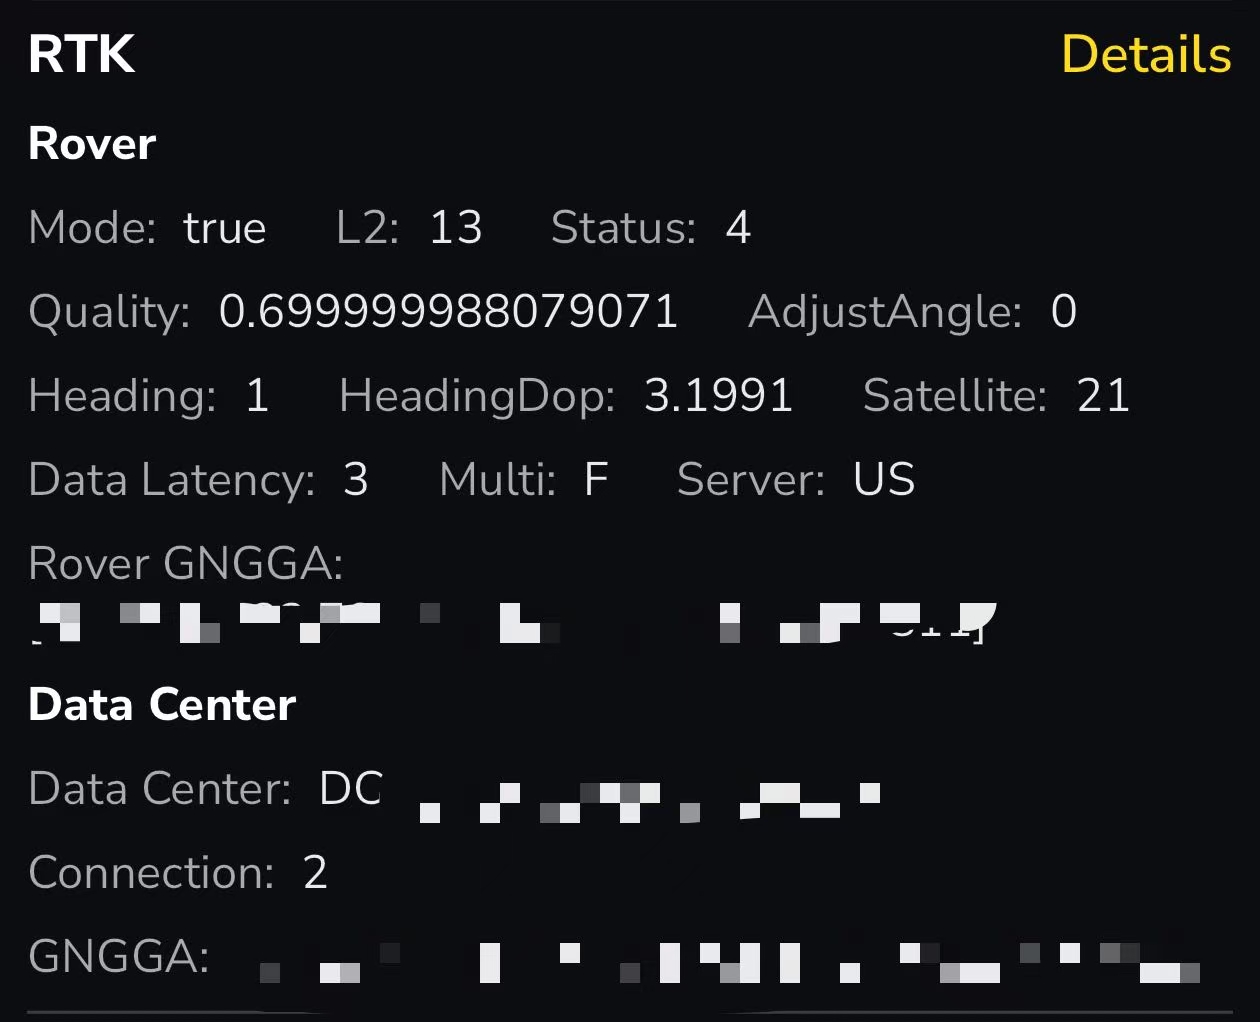
¶ Rover
Refers to the RTK module inside the Yarbo Core.
¶ Mode
- True means the Data Center or Public NTRIP has been initialized successfully. A True status is required before RTK can function properly, and RTK is also required for mapping.
- False means the Data Center (DC) or Public NTRIP has not been initialized successfully. You can first try tapping the Refresh button on the Diagnosis page and check again.
If the issue still persists, please keep the DC installed in the same physical location and perform Reinstall DC in the app.
¶ L2
Represents the number of shared satellites visible to both the left and right antennas.
You typically want this to be greater than 10 and ideally at least 15. The lower the number, the more likely you are to have a loss of GPS and the rover will pause. This is normal so that the rover can wait for a better signal and get a solid fix on its position. Usually it will resume on its own. If after 30 mins it doesn’t, you can move Yarbo out into the open and resume.
¶ Status
There are 4 possible Status values: 1 / 2 / 4 / 5
- 1: Yarbo has not started using or receiving RTCM data yet. This usually happens when Yarbo has just powered on, when the DC connection is interrupted, or when RTCM data is lost.
- 2: Yarbo is not receiving data from the Data Center (DC) or Public NTRIP.
- 4: RTK status is normal.
- 5: Positioning quality has decreased. This may indicate poor GPS signal on the left antenna or the base station.
When performing Correct Map Drift, please also make sure:
- Status = 4
- Quality > 0.9
¶ Quality
Quality represents the RTK positioning quality, with a value range from 0 to 1.0.
A value higher than 0.9 indicates high positioning quality.
¶ Adjust Angle
Indicates initialization success of sensor fusion positioning:
- 0 & 1: Success
- -1: Failure (e.g., RTK≠4 or HeadingDop too high)
- -2: No valid RTK data
¶ Heading
RTK angle output status:
- -1: No reliable heading
- 1: Reliable heading within ±2°
¶ HeadingDop
The lower the number is to zero the better. Anything close to 2 is poor and over 2 is unusable.
At 2 the rover switches to internal sensors like the IMU and wheel odometers to try and compensate for loss/poor GPS. It can only compensate for so long and then it will pause and wait for a good RTK status (4).
The number is impacted by noise, reflections, absorption, etc of GPS signal. For instance, placing your docking station under the eves of your home and up against the foundation can cause the HDOP to be high and result in poor to no GPS conditions when docked or docking. Satellites are always moving along with a number of other environmental factors that can affect this.
It is normal for this number to fluctuate wildly, but generally you don’t want it to continually be near or above 2.
¶ Satellite
This value represents the number of shared satellites visible to both the Data Center (DC) and the left antenna of the Yarbo Rover.
This number isn’t important. As long as it is generally above 20, it is fine. L2 is the more important satellite count to pay attention to.
¶ Data Latency (Age)
Data Latency Indicates the time elapsed since the Rover last received valid RTCM data.
This should be 1-2 normally. Anything higher than that reboot the DC or the rover and see if it gets better. If not, reboot your home router. Anything more than 15 is unusable.
¶ Multi (True/False)
Indicates whether multiple DCs are broadcasting RTCM to the Core.
¶ Server
Shows the server location used for RTK/NTRIP communication (e.g., US).
¶ ROVER GGA: [1/2/5/4, W/E, LON, N/S, LAT]
Rover's real-time location info:
- 1st field: RTK Status
- 2nd & 3rd: Longitude (W/E, LON)
- 4th & 5th: Latitude (N/S, LAT)Format: DDDMM.MMMM (e.g., 07246.1 = 72°46.1′ = 72.7683°). Blank fields may indicate antenna issues.
¶ Data Center Information
The device containing the RTK base module.
¶ DC_SN
Serial number of the Data Center.
¶ Connection (0/1/2/3/4)
Connection has 5 possible status values: 0 / 1 / 2 / 3 / 4
It represents how RTCM data is transmitted from the Data Center (DC) to the Yarbo Core:
- 0 – RTCM data from the DC cannot be transmitted to the Yarbo Core.
- 1 – RTCM data is transmitted from the DC to the Yarbo Core through LoRa.
- 2 – RTCM data is transmitted from the DC to the Yarbo Core through NTRIP.
- 3 – RTCM data is transmitted from the DC to the Yarbo Core through the local HaLow network.
- 4 – RTCM data is provided through Public NTRIP.
Note: Normally, the status should display as 2. However, if it switches back and forth between 2 and 3, this is considered normal behavior. It means the DC is transmitting RTCM data through both the local network and NTRIP at the same time, while Yarbo automatically uses whichever RTCM data arrives fastest.
¶ GNGGA: [1/7, W/E, LON, N/S, LAT]
DC output GPS data:
- 1st: RTK Status (1 or 7; 7 = broadcasting)
- 2nd & 3rd: Longitude
- 4th & 5th: Latitude Blank means DC antenna failure or disconnection.
¶ Status Information

The Status module provides details about the device's operational state and automatic scheduling.
¶ PRP (Plan, Recharge, Pause)
Indicates the status of automatic scheduling for improving efficiency and diagnosing internal scheduling issues.
The status is displayed as a numerical array in the format [0,0,0].The three values correspond to plan, recharge, and pause respectively.
¶ Running
Displays the current operational status of the device.The specific status codes and details can be found in the below documentation or additional references.
| Status Code | Status Explanation |
|---|---|
| 0 | RunningNormal |
| 1 | PedestrianAnimalDetect |
| 2 | RotateHumpDetect |
| 3 | InStuck |
| 4 | SerialLoss |
| 5 | GetAngleError |
| 6 | WaitForRTK |
| 7 | WaitForChuteArrive |
| 8 | CameraError |
| 9 | HumpAdjustDetect |
| 10 | HumpFinishBack |
| 11 | WaitForPushRodArrive |
| 12 | ChuteOverCurrent |
| 13 | WaitForRollerArrive |
| 14 | VisionBypassing |
| 15 | RunningError |
| 16 | WaitForBladeArrive |
| 17 | WaitForBladeSpeed |
| 18 | CollisionAdjust |
| 19 | IsDeadendObstacle |
| 20 | WaitForBladeTemp |
| 21 | BypassingReturnAction |
| 22 | NodeError |
| 23 | WaitForBlowerArrive |
¶ Main Information
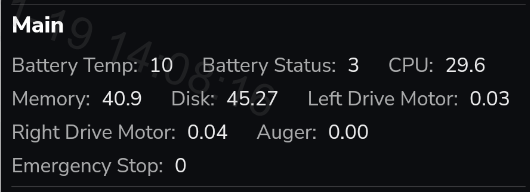
The Main module provides details about the machine's operational parameters, including battery, CPU, memory, and motor statuses.
¶ Battery Temp
Displays the temperature of the battery to check if it is too low or too high.Data shown as a numerical value.
¶ Battery Status
Shows the current status of the battery.
States include: Charging, Discharging, or Heating.
¶ CPU Usage
Displays the percentage of CPU currently in use.
- Data shown as a percentage.
- 0: Indicates the device is not connected.
¶ Memory Usage
Shows the memory utilization percentage to diagnose potential issues.
- Data shown as a percentage.
- 0: Indicates the device is not connected.
¶ Disk Usage
Displays the disk usage percentage for diagnosing storage-related issues like log file management. Data shown as a percentage.
¶ Left Drive Motor
Displays the current usage of the left drive motor to evaluate its performance. Data shown as a numerical value.
¶ Right Drive Motor
Shows the current usage of the right drive motor for performance assessment. Data shown as a numerical value.
¶ Auger
Displays the current power usage of the auger (snow blower). Data shown as a numerical value.
¶ Emergency Stop
Displays whether the emergency-stop system has been triggered on the rover’s main body or front module. The value shown represents the current detection state:
¶ Status Codes
- 0 — Not Triggered
No emergency stop has been activated on either the body or the front module. - 1 — Body Triggered
The emergency-stop sensor on the rover body has been activated. - 2 — Front Module Triggered
The emergency-stop sensor on the front attachment/module has been activated. - 3 — Both Triggered
Both the rover body and the front module emergency-stop sensors have been activated at the same time.
¶ HaLow Connection Information
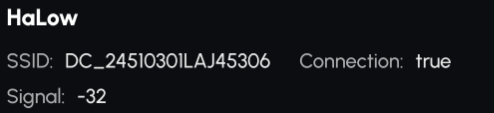
The HaLow module provides details about the wireless HaLow connection, including the network name, connection status, and signal strength.
¶ SSID
Displays the name(SSID) of the Data Center.
¶ Connection
True is working normal. False indicates a problem and could be because the rover is out of range or the DC needs to be rebooted.
¶ Signal
Indicates the signal strength of the HaLow connection.
- Data shown as a numerical value.
- Values closer to 0 represent stronger signals.
If the HaLow signal falls to –82 dBm or below, the system will automatically switch to 4G.
When operating over 4G, if the HaLow signal rises to –77 dBm or above, it will automatically switch back to HaLow.
¶ Sensor Information

The Sensor module provides data from various sensors, including rain and ultrasonic sensors, to monitor environmental and operational parameters.
¶ Rain Sensor
- Description: Displays the value from the rain sensor.
- Usage: Indicates the amount of rain detected.
- Notes:
- Values are shown as numbers.
- The more rain detected, the better the conductivity (lower resistance), resulting in smaller values.
- Default threshold is 1000 and is adjustable.
¶ Front Ultrasonic Sensor
- Description: Displays the values from the front ultrasonic sensors.
- Usage: Used for distance measurement or obstacle detection.
- Notes: Values are shown as numbers.
¶ Camera Information
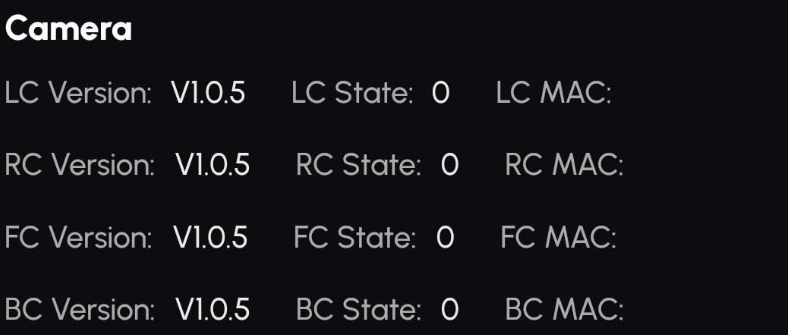
The Camera module provides details about the camera's version, status, and MAC address for all camera modules (LC: Left Camera, RC: Right Camera, FC: Front Camera, BC: Back Camera).
¶ Version
- Description: Displays the version number of the camera firmware.
- Usage: Used to verify the camera's firmware version.
- Notes: Shown as a numerical value (e.g., V1.0.0).
¶ State
Description: Displays the current state of the camera.
Usage: Helps determine the operational status of the camera.
Notes:
- 0: Normal operation.
- 1: Disabled.
- 2: Camera disconnected.
- 3: Camera ping failed.
Additional explanation:
- If ping fails, it indicates the camera module is not reachable.
- Disconnection may occur after initial proper operation.
¶ MAC Address
Displays the MAC address of the camera.
¶ Bluetooth
¶ Version
- Description: Displays the version number of the camera firmware.
¶ Status
- Displays connection status of Bluetooth.